Technical Writer II

Introduction
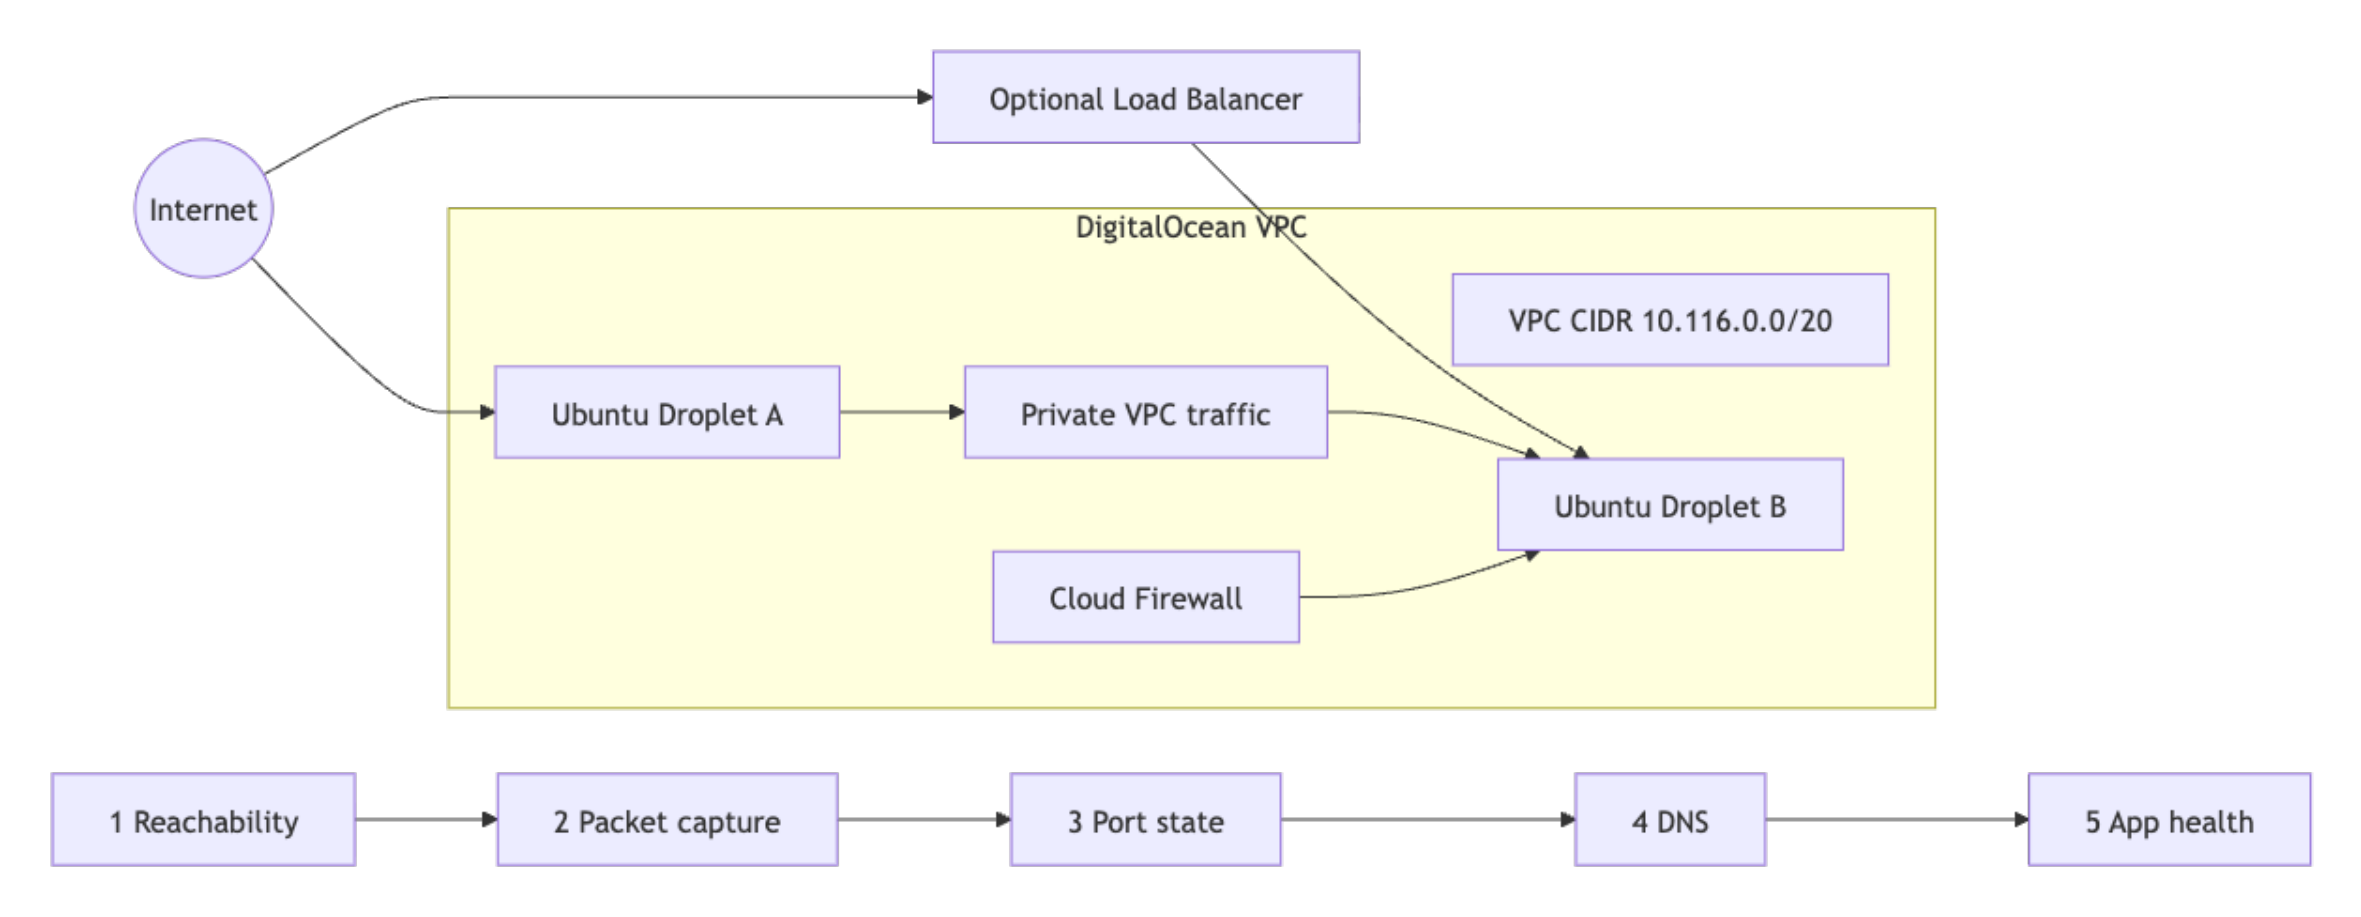
Network incidents on a DigitalOcean VPC get resolved faster when every responder follows the same diagnostic sequence instead of improvising. This tutorial walks through building a reusable runbook for common VPC failures using ping, traceroute, tcpdump, nmap, dig, nslookup, nmcli, ss, and curl, then shows how to turn the most repeatable checks into automated DigitalOcean Functions.
A runbook removes the guesswork during incidents. Every responder starts at the same layer, runs the same commands, and produces the same evidence. That consistency matters most during critical incidents when a responder needs to isolate a Cloud Firewall block from an in-Droplet firewall block before escalating.
In this tutorial, you will learn how to diagnose VPC connectivity failures, distinguish between Cloud Firewall and in-Droplet firewall blocks, and build a structured network troubleshooting runbook.
Key Takeaways
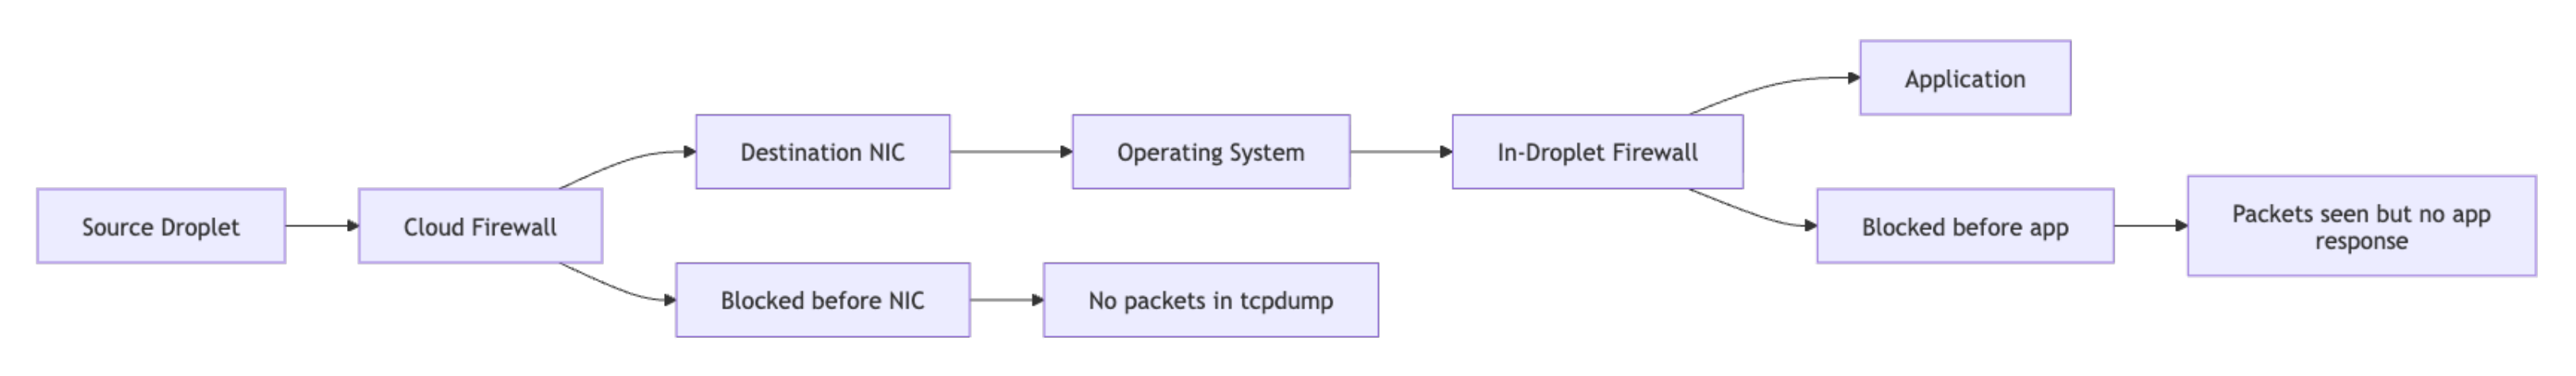
- The fastest way to tell whether a Cloud Firewall or an in-Droplet firewall is blocking your traffic: if
tcpdumpon the destination interface shows no packets at all, the block is at the Cloud Firewall level. If packets are visible but there is no response, the block is inside the Droplet. - Run diagnostic tools in a fixed layer sequence: reachability first, then packet capture, then port state, then DNS, then application. Jumping to a higher layer before confirming the lower layer wastes time when a lower-layer failure is masking the real symptom.
nmap -Pnis required when Cloud Firewalls block ICMP. Without-Pn, nmap reports all hosts as down even when they are reachable on TCP.- Ubuntu 24.04 Droplets using
systemd-resolvedwill show127.0.0.53in/etc/resolv.conf, not the DigitalOcean resolver IPs directly. Queryresolvectl status eth1to see the actual upstream resolvers in use. - Runbook steps with structured inputs and outputs (IP address, port, DNS name) are candidates for DigitalOcean Functions and can be registered as callable function routes in a AI Platform agent.
Prerequisites
Before following this tutorial, you need:
- Two or more Ubuntu 22.04 or later Droplets in the same DigitalOcean VPC.
- A DigitalOcean Cloud Firewall attached to one or more Droplets.
- A DigitalOcean Load Balancer targeting at least one Droplet backend (optional, required for Step 5 and Runbook Entry 2).
sudoaccess on all test Droplets.tcpdump,nmap,dnsutils,traceroute,iproute2,net-tools,curl, andjqinstalled on all Droplets. Install them with:
sudo apt update
sudo apt install -y tcpdump nmap dnsutils traceroute iproute2 net-tools curl jq
Confirm the install with tcpdump --version and nmap --version. Both should print a version string rather than command not found.
Understanding DigitalOcean VPC Networking Fundamentals
DigitalOcean VPC troubleshooting gets faster when you can separate packet path controls, interface scope, and health-check flow before inspecting any logs.
Cloud Firewalls vs. In-Droplet Firewalls
Cloud Firewalls filter traffic at the hypervisor layer before packets reach the Droplet interface. In-Droplet tools such as ufw, iptables, or nftables run inside the operating system after the packet arrives.
This distinction determines your entire diagnostic path:
- If expected packets are absent in
tcpdumpon the destination interface, investigate Cloud Firewall policy first. - If packets are visible in
tcpdumpbut there is no application response, investigate in-Droplet firewall rules, service binding, or process health.
Both layers can be active simultaneously and each enforces its rules independently.
Use the following steps to check and modify Cloud Firewall rules.
To list all inbound rules on a Cloud Firewall using doctl:
doctl compute firewall list
ID                                      Name              Status     Created At
a1b2c3d4-0000-0000-0000-111122223333    vpc-firewall      succeeded  2026-01-10T09:00:00Z
Copy the ID from the first column of the firewall you want to inspect. The next command uses this UUID to fetch the complete rule set.
Retrieve the full rule set for that firewall using its ID:
doctl compute firewall get a1b2c3d4-0000-0000-0000-111122223333
ID:                      a1b2c3d4-0000-0000-0000-111122223333
Name:                    vpc-firewall
Status:                  succeeded
Inbound Rules:
Protocol    Ports    Sources
tcp         22       0.0.0.0/0
tcp         80       0.0.0.0/0
To add a missing inbound rule that allows TCP traffic on port 5432 from a specific Droplet, substitute <firewall-id> with the ID returned by the earlier doctl compute firewall list command and <droplet-id> with the source Droplet’s ID:
doctl compute firewall add-rules <firewall-id> \
  --inbound-rules "protocol:tcp,ports:5432,droplet_id:<droplet-id>"
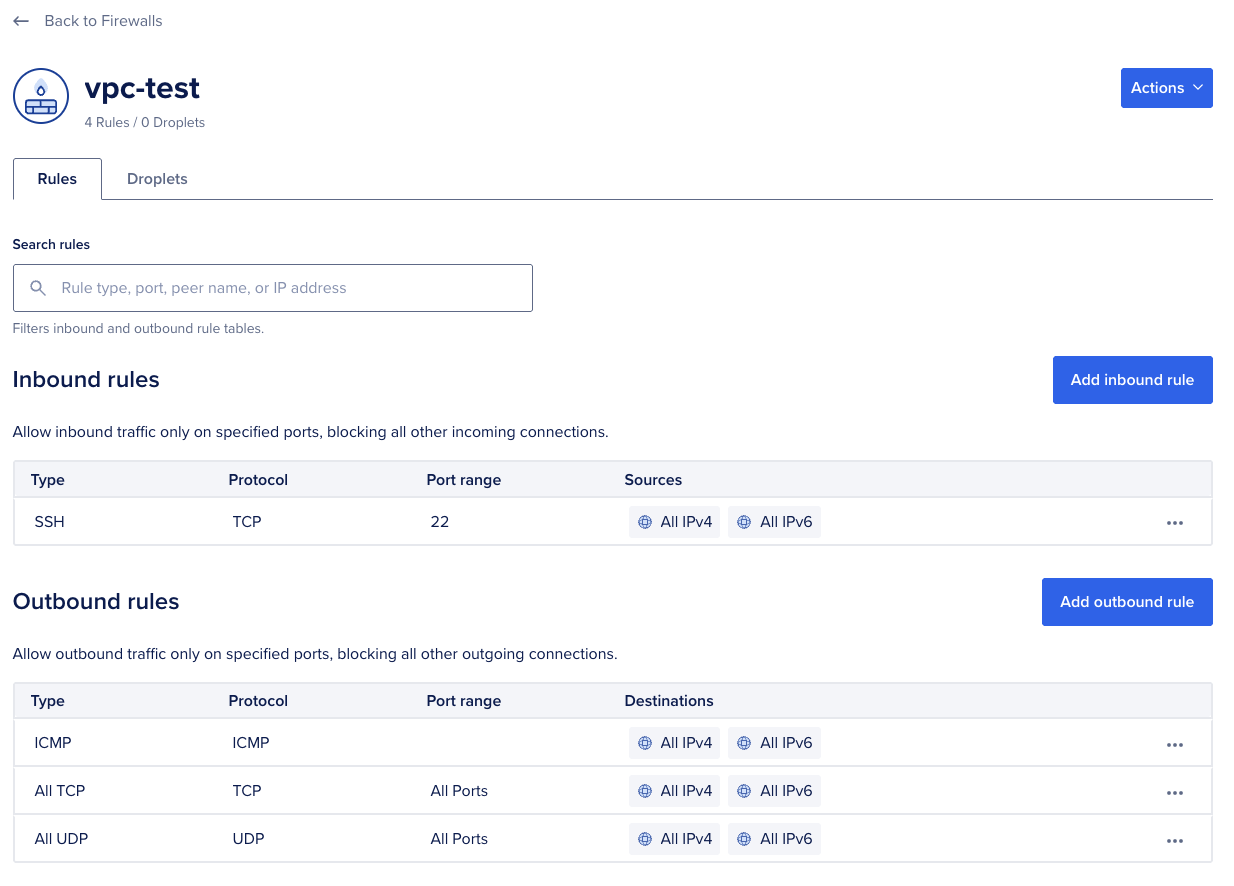
You can also manage rules in the DigitalOcean control panel under Networking > Firewalls. Select the firewall, go to the Inbound Rules tab, and add the required protocol, port range, and source.
Note: Cloud Firewall rule changes take effect without requiring a Droplet or service restart.
Use the following steps to check and modify in-Droplet firewall rules.
If tcpdump confirms packets are arriving but the service is not responding, check ufw status and active rules:
sudo ufw status verbose
Status: active
Logging: on (low)
Default: deny (incoming), allow (outgoing), disabled (routed)

To                         Action      From
--                         ------      ----
22/tcp                     ALLOW IN    Anywhere
80/tcp                     ALLOW IN    Anywhere
Check the To and Action columns. Any port not listed here is blocked by default. If the port your service uses is absent, add it with the command below.
sudo ufw allow 5432/tcp
To check raw iptables rules if ufw is not in use:
sudo iptables -L INPUT -n -v
Chain INPUT (policy DROP 0 packets, 0 bytes)
 pkts bytes target     prot opt in     out     source               destination
 1243  156K ACCEPT     all  --  lo     *       0.0.0.0/0            0.0.0.0/0
  892   87K ACCEPT     tcp  --  *      *       0.0.0.0/0            0.0.0.0/0            tcp dpt:22
   45  2700 ACCEPT     tcp  --  *      *       0.0.0.0/0            0.0.0.0/0            tcp dpt:80
    0     0 DROP       tcp  --  *      *       0.0.0.0/0            0.0.0.0/0            tcp dpt:5432
In the output above, ACCEPT rules for ports 22 and 80 let those services through, while the DROP rule on port 5432 blocks PostgreSQL traffic before it reaches the application. A DROP rule with no preceding ACCEPT for your service port means the in-Droplet firewall is blocking traffic before it reaches the application.
VPC Private vs. Public Interface
VPC traffic traverses a private interface, typically eth1 or, on newer networkd-based images, ens4. Capturing on the wrong interface produces false negatives, so always confirm interface naming before running any packet capture.
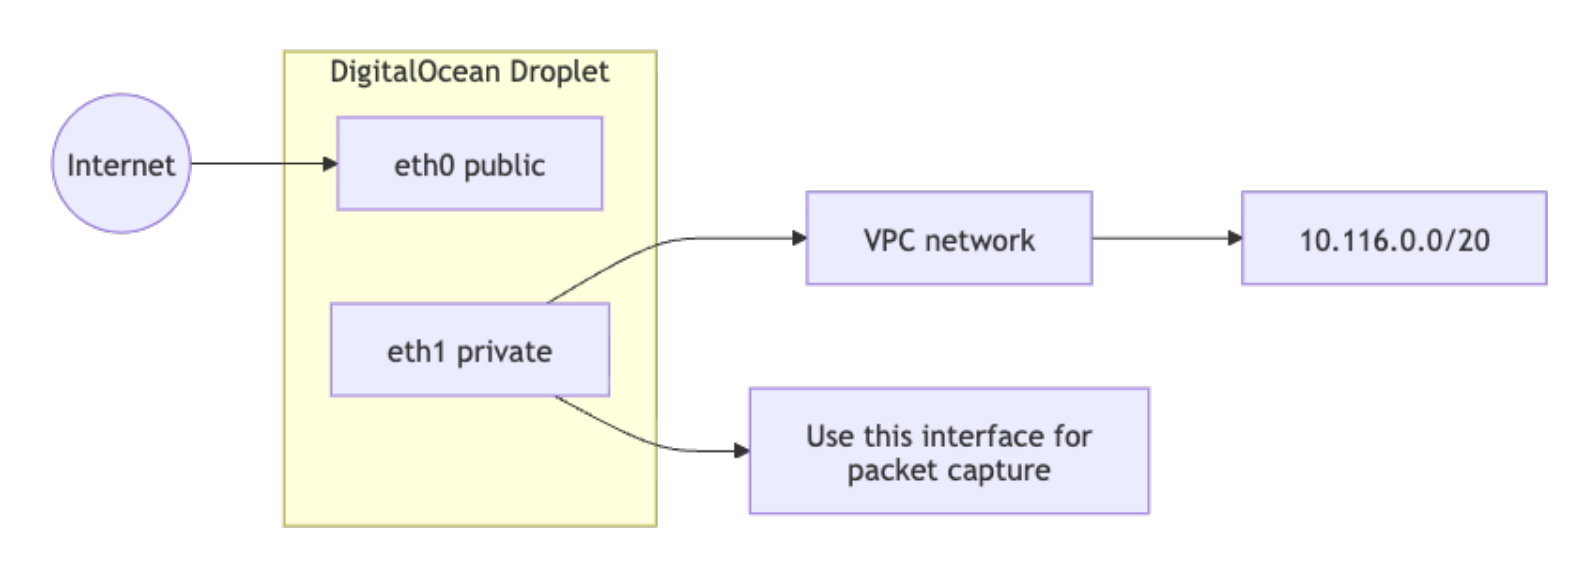
Run ip link show to list all network interfaces and identify the VPC private interface by name. On standard Ubuntu Droplet images, eth0 is the public interface and eth1 is the VPC private interface:
ip link show
2: eth0: <BROADCAST,MULTICAST,UP,LOWER_UP> mtu 1500 qdisc fq_codel state UP mode DEFAULT
3: eth1: <BROADCAST,MULTICAST,UP,LOWER_UP> mtu 1500 qdisc fq_codel state UP mode DEFAULT
In this output, eth1 is the VPC private interface. Use this name for all subsequent tcpdump, nmap, and ss commands in this tutorial. If your Droplet uses networkd-based naming, you will see ens3 and ens4 instead.
Confirm the private IP assigned to the VPC interface:
ip addr show eth1
3: eth1: <BROADCAST,MULTICAST,UP,LOWER_UP> mtu 1500 qdisc fq_codel state UP
    inet 10.116.0.12/20 brd 10.116.15.255 scope global eth1
       valid_lft forever preferred_lft forever
Load Balancer Health Checks
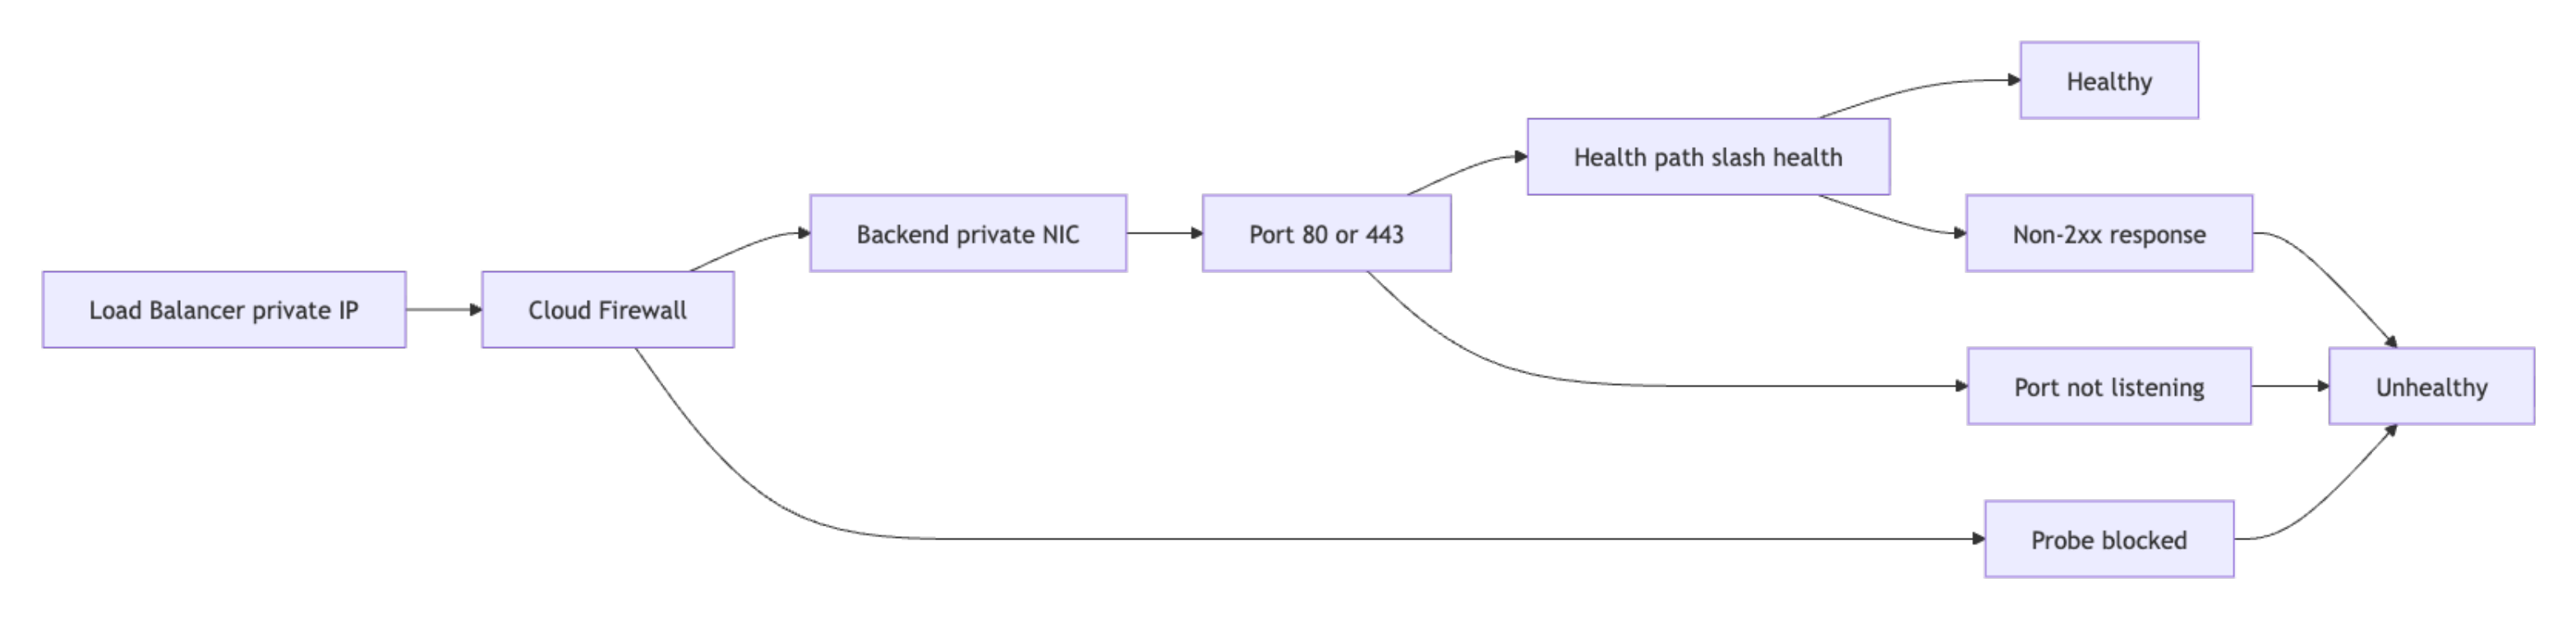
Load Balancer availability depends on successful health checks to backend Droplets. A backend fails health checks when the process is bound to the wrong interface, when local firewall rules block probe traffic, or when the health check path returns a non-2xx status code. The diagnostic steps for this failure mode are covered in Step 5.
Essential Network Troubleshooting Tools
Map each tool to a troubleshooting layer and use them in a fixed order from the bottom of the network stack upward.
| Tool | Purpose | Layer |
|---|---|---|
ping |
Verify basic ICMP reachability and packet loss | Network |
traceroute |
Identify hop path and routing changes | Network |
nmcli |
Inspect connection profiles and DNS settings | Host network config |
tcpdump |
Capture packet-level evidence on interface and ports | Network/Transport |
nmap |
Test port exposure and service state | Transport/Application |
ss |
Confirm local listening sockets and process binding | Host transport |
dig |
Query DNS resolvers and inspect response metadata | Application |
nslookup |
Quick DNS lookup comparison across resolvers | Application |
curl |
Validate HTTP/S endpoint behavior and headers | Application |
Step 1 - Verify Basic Reachability with ping and traceroute
Start by confirming path existence and loss profile, because reachability failures make later service-level checks irrelevant until routing is fixed.
ping -c 4 10.116.0.22
PING 10.116.0.22 (10.116.0.22) 56(84) bytes of data.
64 bytes from 10.116.0.22: icmp_seq=1 ttl=64 time=0.512 ms
64 bytes from 10.116.0.22: icmp_seq=2 ttl=64 time=0.489 ms
64 bytes from 10.116.0.22: icmp_seq=3 ttl=64 time=0.476 ms
64 bytes from 10.116.0.22: icmp_seq=4 ttl=64 time=0.501 ms

--- 10.116.0.22 ping statistics ---
4 packets transmitted, 4 received, 0% packet loss, time 3063ms
rtt min/avg/max/mdev = 0.476/0.494/0.512/0.013 ms
If ping fails to a VPC-private IP, verify that your Cloud Firewall inbound rules permit ICMP traffic from the source Droplet’s IP or tag. ICMP is not allowed by default unless explicitly added as an inbound rule.
If packet loss is high or complete, run traceroute to identify where traffic diverges:
traceroute -n 10.116.0.22
traceroute to 10.116.0.22 (10.116.0.22), 30 hops max, 60 byte packets
 1  10.116.0.22  0.372 ms  0.334 ms  0.297 ms
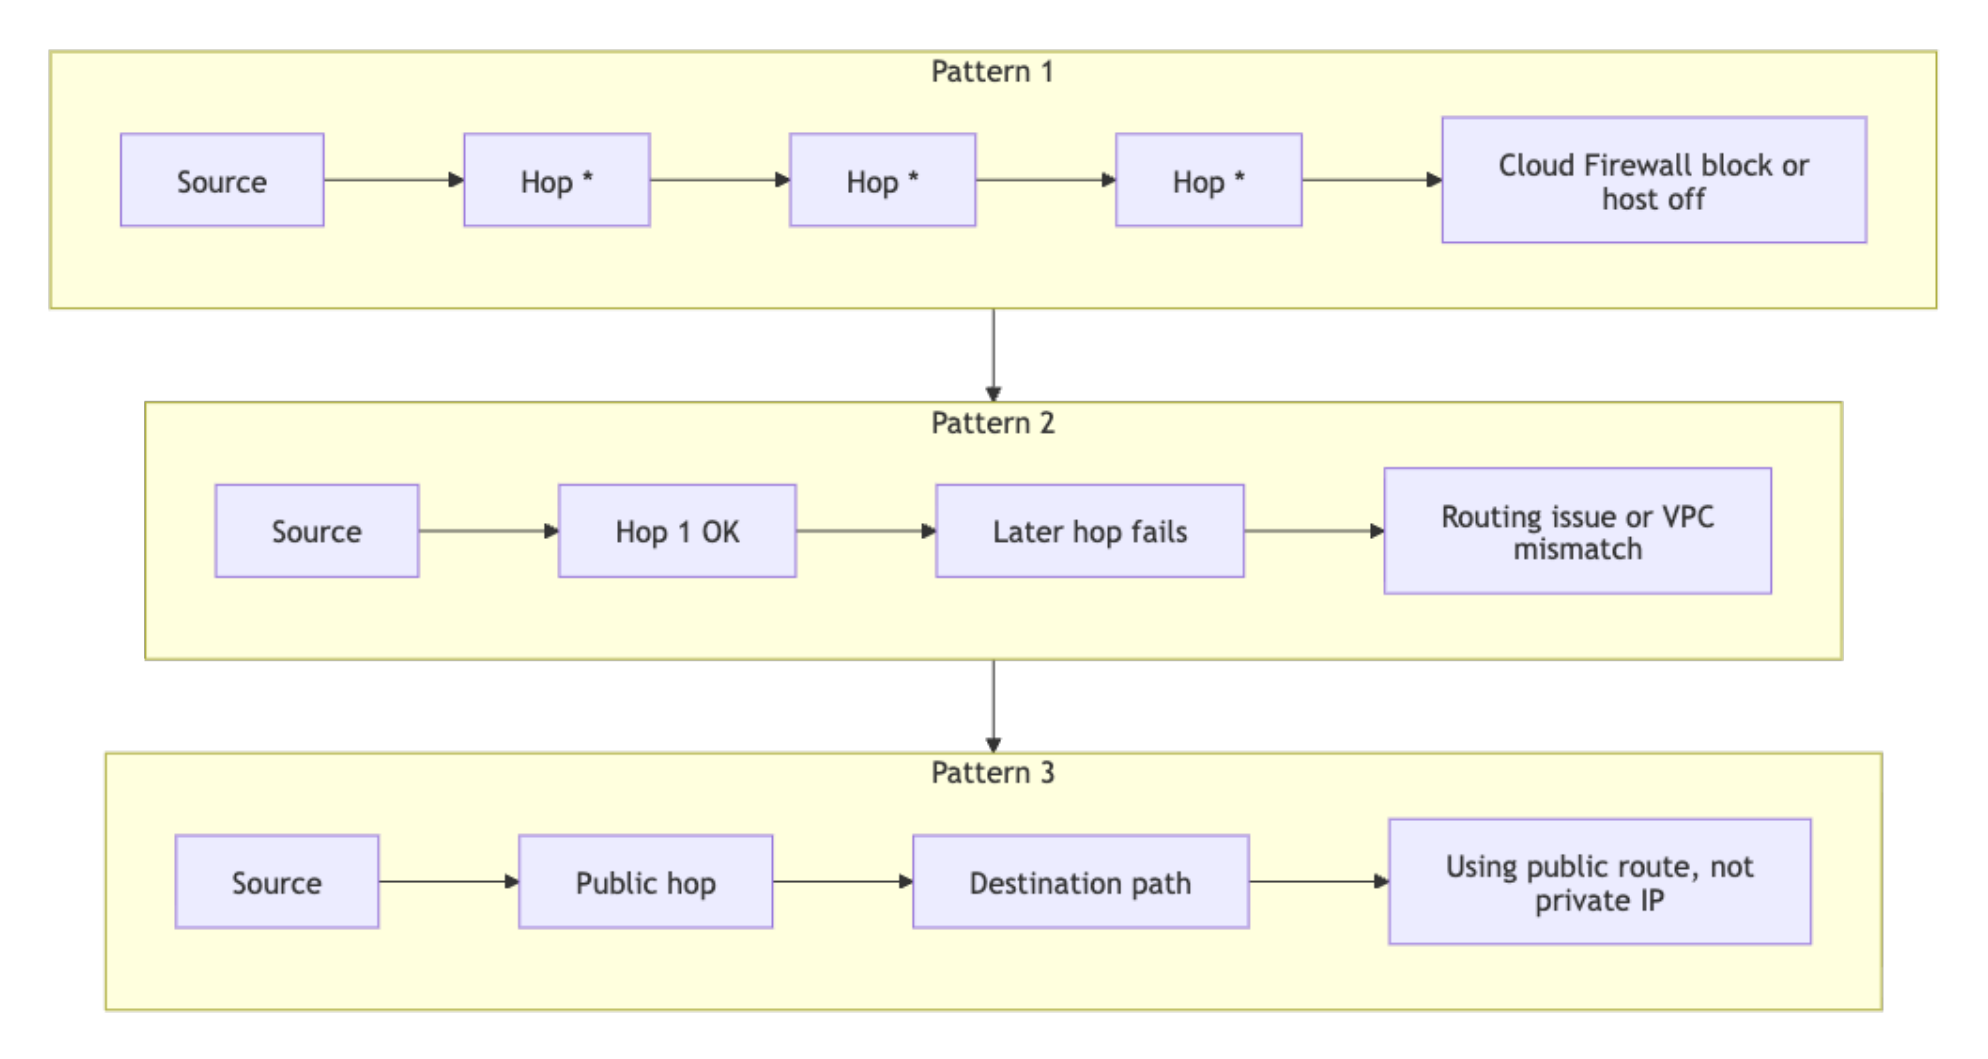
In a healthy VPC, traffic between Droplets arrives in one hop, though traceroute output can vary depending on ICMP handling along the path. If you see multiple hops or repeated * * * responses, use the following guide to interpret the output:
traceroute to 10.116.0.22 (10.116.0.22), 30 hops max, 60 byte packets
 1  * * *
 2  * * *
 3  * * *
- All hops return
* * *: the destination is not responding to ICMP and no intermediate hop is replying. This can indicate Cloud Firewall blocking, a powered-off destination, or a path where ICMP replies are suppressed. Confirm withtcpdumpand firewall inspection before concluding. - First hop responds but subsequent hops do not: traffic is leaving the source but not arriving at the destination. Check whether both Droplets are assigned to the same VPC in the control panel.
- First hop IP is not the destination and is not in the VPC CIDR range: traffic is being routed through the public interface instead of the private VPC interface. Confirm the target IP is the private IP, not the public IP.
For hosts using NetworkManager, verify the active profile, interface state, and DNS settings in one command:
nmcli device show eth1
GENERAL.DEVICE:                         eth1
GENERAL.STATE:                          100 (connected)
IP4.ADDRESS[1]:                         10.116.0.12/20
IP4.GATEWAY:                            --
IP4.DNS[1]:                             67.207.67.2
IP4.DNS[2]:                             67.207.67.3
If eth1 shows a state other than connected, the VPC private interface is not active. This typically means the Droplet was not created with a VPC assigned or the interface was manually disabled inside the OS.
Step 2 - Capture Packets with tcpdump
When ping passes but a service still fails, tcpdump is the next stop. Packet capture answers two questions cleanly: did the traffic reach the destination interface, and did the TCP handshake actually complete.
Start with a single-interface capture on the VPC interface:
sudo tcpdump -ni eth1
tcpdump: verbose output suppressed, use -v[v]... for full protocol decode
listening on eth1, link-type EN10MB (Ethernet), snapshot length 262144 bytes
15:03:11.101252 IP 10.116.0.12.53342 > 10.116.0.22.80: Flags [S], seq 249715243, win 64240, length 0
15:03:11.101406 IP 10.116.0.22.80 > 10.116.0.12.53342: Flags [S.], seq 94735512, ack 249715244, win 65160, length 0
15:03:11.101421 IP 10.116.0.12.53342 > 10.116.0.22.80: Flags [.], ack 1, win 502, length 0
The -ni flag combination disables reverse DNS lookups and sets the interface. TCP flags to recognize:
Sis SYN: the client starts a connection.S.is SYN-ACK: the server acknowledges and responds..is ACK: the client confirms and the session is established.Ris RST: often indicates no listener, active rejection, or policy reset.Fis FIN: the session is closing normally.
Use narrower filters to reduce noise during incidents. Filter by source IP when you want to isolate traffic from one specific Droplet:
sudo tcpdump -ni eth1 src 10.116.0.12
Filter by port when you want to see all traffic on a specific service, regardless of source:
sudo tcpdump -ni eth1 port 443
Combine both filters to narrow the capture to a specific source and port pair:
sudo tcpdump -ni eth1 'src 10.116.0.12 and port 443'
Save captures to a PCAP file for later comparison or Wireshark analysis:
sudo tcpdump -ni eth1 port 443 -w incident-443.pcap
tcpdump: listening on eth1, link-type EN10MB (Ethernet), snapshot length 262144 bytes
128 packets captured
128 packets received by filter
0 packets dropped by kernel
Measure SYN to SYN-ACK handshake latency directly from capture output. The -tt flag outputs raw Unix timestamps, which the awk script uses to calculate the time between a SYN packet and its matching SYN-ACK. To avoid mixing up concurrent connections to the same host, the script uses both TCP endpoints as the lookup key: $3 and $5 for the SYN, and the reversed pair for the SYN-ACK. The gsub calls strip trailing colons from the address fields, which older tcpdump versions (4.9.x) append and newer versions (4.99.x) do not, so the same script works across both:
sudo tcpdump -tt -ni eth1 'tcp[tcpflags] & (tcp-syn|tcp-ack) != 0 and port 443' | awk '
{gsub(/:$/, "", $3); gsub(/:$/, "", $5)}
/Flags \[S\]/ {key=$3 " " $5; if (!(key in syn)) syn[key]=$1}
/Flags \[S\.\]/ {key=$5 " " $3; if (key in syn) {print "Handshake latency:", ($1-syn[key])*1000, "ms"; delete syn[key]}}'
Handshake latency: 0.281572 ms
Handshake latency: 0.295401 ms
Handshake latency: 0.302017 ms
Warning: PCAP files can contain sensitive data including internal IPs, hostnames, and application payload metadata. Store PCAP files in restricted locations and delete them after incident closure according to your data retention policy.
Step 3 - Scan Ports with nmap
nmap answers one question that matters during incidents: is this port open, filtered, or closed. Each answer points to a different fix, so the state matters more than the raw output.
Run a targeted TCP port check. The -Pn flag skips host discovery, which you always want inside a VPC because Cloud Firewalls block ICMP by default and ICMP-based host discovery will falsely mark every Droplet as down:
nmap -Pn -p 22,80,443 10.116.0.22
Starting Nmap 7.94 ( https://nmap.org ) at 2026-04-16 15:09 UTC
Nmap scan report for 10.116.0.22
Host is up (0.00070s latency).

PORT    STATE    SERVICE
22/tcp  open     ssh
80/tcp  filtered http
443/tcp closed   https
Interpret port states consistently and use each state to drive the next action:
open: an application accepted the connection. Move to application-layer checks.filtered: probes were blocked or dropped by a firewall. Move to Cloud Firewall and routing checks.closed: host is reachable but no process is listening on that port. Move to service startup and bind address checks.
Run a UDP scan when DNS or other UDP-based protocols are involved:
sudo nmap -sU -Pn -p 53,123 10.116.0.22
PORT    STATE         SERVICE
53/udp  open|filtered domain
123/udp closed        ntp
UDP ports return open|filtered when nmap cannot confirm the state because no ICMP unreachable response was received. This is expected behavior for UDP. Treat open|filtered as potentially open and verify at the application layer.
Run service version detection to confirm the expected daemon is answering:
sudo nmap -sV -Pn -p 80,443 10.116.0.22
PORT    STATE SERVICE VERSION
80/tcp  open  http    nginx 1.24.0
443/tcp open  ssl/http nginx 1.24.0
Version detection catches two common production incidents: a deploy that failed to roll forward (the running version will not match the expected release), and a Droplet that was reverted to a prior image after a rollback. If the version shown does not match what you deployed, the wrong daemon is answering the port. If a port shows closed here but appeared open in an earlier scan, the service stopped between the two scans.
Run a subnet ping scan to discover all live hosts in the VPC:
nmap -sn 10.116.0.0/24
Nmap scan report for 10.116.0.12
Host is up.
Nmap scan report for 10.116.0.22
Host is up.
Nmap done: 256 IP addresses (2 hosts up) scanned in 2.84 seconds
If a Droplet you expect to find does not appear in the results, verify it is powered on and assigned to the same VPC. A missing host here points to a Droplet state or VPC assignment issue, not a firewall rule.
Warning: Only run nmap against infrastructure you own and have explicit permission to scan. Running aggressive scans against external hosts may violate DigitalOcean’s Terms of Service and applicable laws.
Step 4 - Diagnose DNS with dig and nslookup
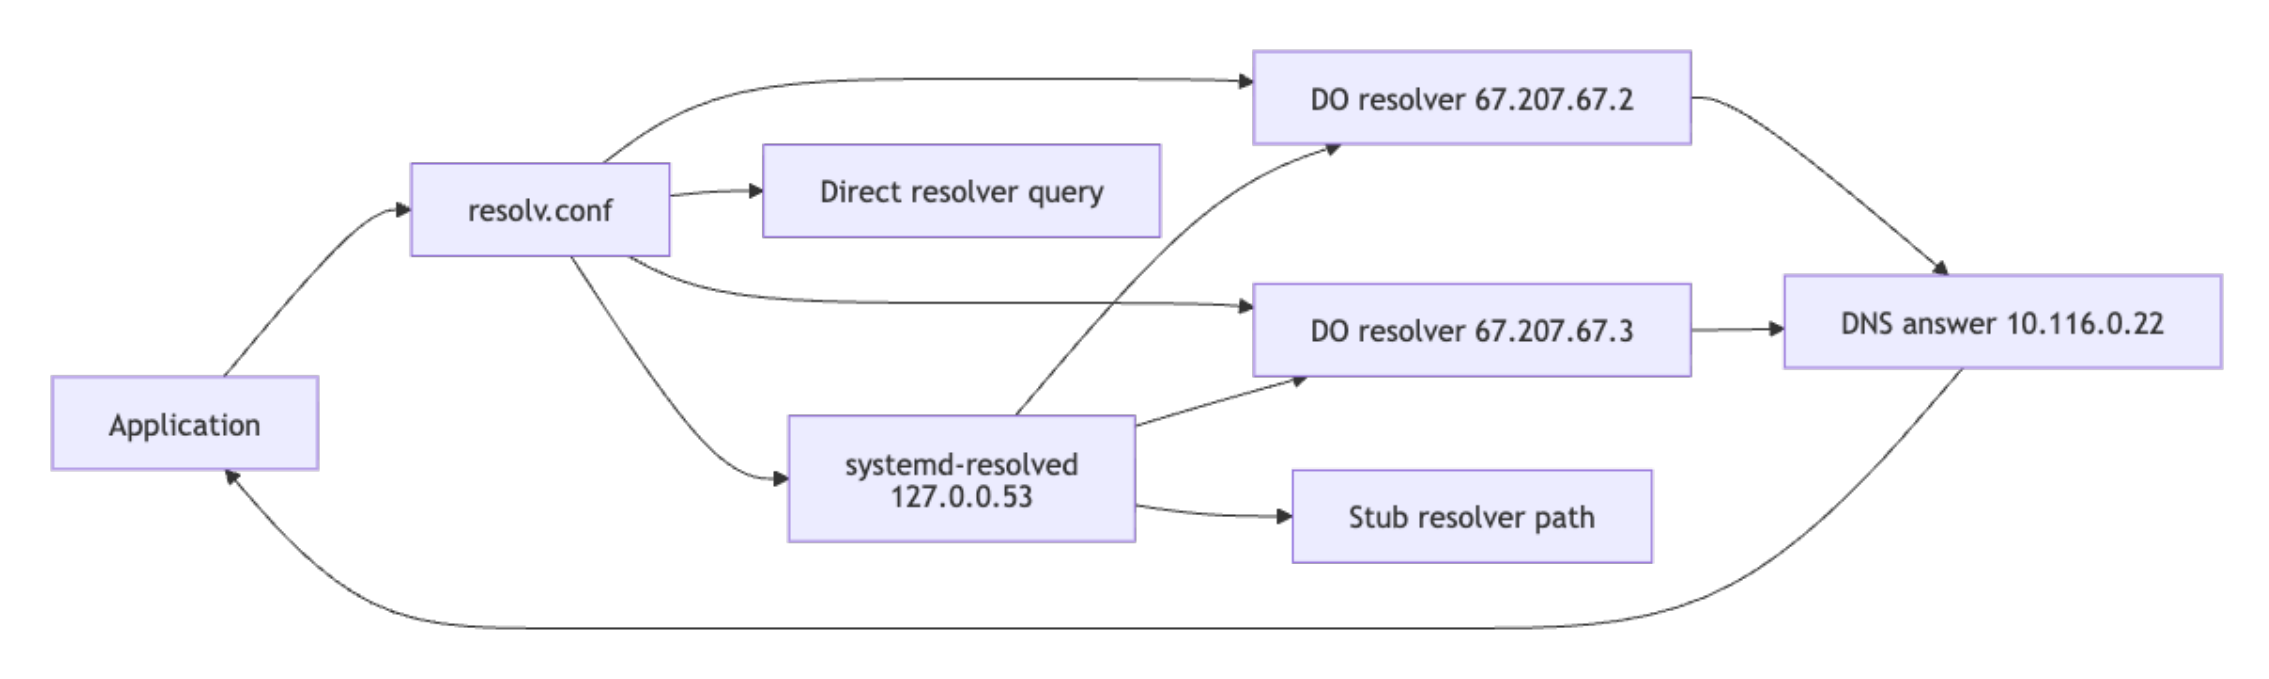
A service that answers on its IP address but fails by hostname is a DNS issue, not a network issue, and chasing it as a network problem wastes time. The sequence below isolates whether the resolver is wrong, whether the query is leaving the Droplet, and whether the two DigitalOcean resolvers agree on the answer.
Check resolver configuration first:
cat /etc/resolv.conf
nameserver 67.207.67.2
nameserver 67.207.67.3
search internal.example
If both DigitalOcean resolver IPs (67.207.67.2 and 67.207.67.3) appear here, resolver configuration is likely correct for a default DigitalOcean setup. On Ubuntu 24.04 Droplets using systemd-resolved, /etc/resolv.conf points to the local stub resolver at 127.0.0.53 instead. Run the following command to confirm the actual upstream resolvers in use:
resolvectl status eth1
Link 3 (eth1)
      Current Scopes: DNS
DefaultRoute setting: no
       LLMNR setting: yes
MulticastDNS setting: no
  DNSOverTLS setting: no
      DNSSEC setting: no
    DNSSEC supported: no
  Current DNS Server: 67.207.67.2
         DNS Servers: 67.207.67.2
                      67.207.67.3
If the upstream resolvers shown are not the DigitalOcean IPs, the Droplet is using a custom or overridden DNS configuration.
Query the primary resolver directly. The +noall +answer flags suppress the header and footer sections so only the answer record is shown, which is easier to compare across resolvers during drift detection.
dig @67.207.67.2 api.internal.example A +noall +answer
api.internal.example. 30 IN A 10.116.0.22
Compare against the secondary resolver to detect resolver drift:
dig @67.207.67.3 api.internal.example A +noall +answer
api.internal.example. 30 IN A 10.116.0.22
Run an iterative trace when delegation issues or stale records are suspected:
dig +trace example.com
.                       518400  IN  NS  a.root-servers.net.
com.                    172800  IN  NS  a.gtld-servers.net.
example.com.            172800  IN  NS  a.iana-servers.net.
example.com.            3600    IN  A   93.184.216.34
Use nslookup for a quick second-opinion query:
nslookup api.internal.example 67.207.67.2
Server:         67.207.67.2
Address:        67.207.67.2#53

Name:   api.internal.example
Address: 10.116.0.22
Cross-check DNS egress by capturing port 53 traffic while running a dig query in a second terminal:
sudo tcpdump -ni eth1 port 53
15:22:54.119091 IP 10.116.0.12.52402 > 67.207.67.2.53: 61545+ A? api.internal.example. (38)
15:22:54.119608 IP 67.207.67.2.53 > 10.116.0.12.52402: 61545 1/0/0 A 10.116.0.22 (54)
Each packet line encodes: timestamp, source IP and port, destination IP and port, query ID, query type, and payload size. In this output, 10.116.0.12 sends query ID 61545 for an A record on api.internal.example to 67.207.67.2 on port 53, and the resolver replies 0.5 ms later with one answer (1/0/0) resolving to 10.116.0.22. This confirms both outbound reachability to the resolver and a successful response.
If query packets are leaving the interface and responses are returning, the resolver is reachable and responding. If no packets appear at all, first verify you are capturing on the correct interface and that the query is leaving the host as expected. If both are true, the issue likely lies in interface state, routing, or resolver reachability rather than the DNS record itself.
If one Droplet resolves and another fails, compare cat /etc/resolv.conf, nmcli device show eth1, and direct dig @resolver queries side by side to isolate whether the issue is per-Droplet configuration or upstream.
Step 5 - Troubleshoot Load Balancer Connectivity
A Load Balancer returning 502 or 503 almost always points to one of three things: the backend process isn’t listening on the health check port, the health path is returning a non-200 status code, or a Cloud Firewall rule is dropping probe traffic from the Load Balancer’s private IP. Work through the checks below in that order before changing anything, because changing config without knowing which of the three is at fault usually makes the problem harder to pin down.
Note: To find your Load Balancer’s private IP, navigate to Networking > Load Balancers in the DigitalOcean control panel, select the Load Balancer, and check the Settings tab for the private IP address assigned to your VPC.
Test frontend reachability from within the VPC:
ping -c 3 10.116.0.50
PING 10.116.0.50 (10.116.0.50) 56(84) bytes of data.
64 bytes from 10.116.0.50: icmp_seq=1 ttl=64 time=0.659 ms
64 bytes from 10.116.0.50: icmp_seq=2 ttl=64 time=0.633 ms
64 bytes from 10.116.0.50: icmp_seq=3 ttl=64 time=0.641 ms
curl -v http://10.116.0.50/health
*   Trying 10.116.0.50:80...
* Connected to 10.116.0.50 (10.116.0.50) port 80
> GET /health HTTP/1.1
> Host: 10.116.0.50
> User-Agent: curl/8.5.0
> Accept: */*
< HTTP/1.1 200 OK
< Content-Type: text/plain
< Content-Length: 2
<
OK
Validate backend listener state on each Droplet:
sudo ss -tlnp | grep -E ':80|:443'
LISTEN 0      511          0.0.0.0:80        0.0.0.0:*    users:(("nginx",pid=964,fd=6))
LISTEN 0      511          0.0.0.0:443       0.0.0.0:*    users:(("nginx",pid=964,fd=7))
If the port does not appear in the LISTEN state, the application is not running or is bound to 127.0.0.1 only, which is invisible to the Load Balancer probing over the VPC private interface.
Inspect the health endpoint response on the backend directly:
curl -v http://127.0.0.1/health
*   Trying 127.0.0.1:80...
* Connected to 127.0.0.1 (127.0.0.1) port 80
> GET /health HTTP/1.1
> Host: 127.0.0.1
< HTTP/1.1 200 OK
< Content-Type: text/plain
<
OK
Capture health check probes arriving from the Load Balancer:
sudo tcpdump -ni eth1 host 10.116.0.50 and port 80
15:34:42.002011 IP 10.116.0.50.44902 > 10.116.0.22.80: Flags [S], seq 1483102, win 64240, length 0
15:34:42.002114 IP 10.116.0.22.80 > 10.116.0.50.44902: Flags [S.], seq 2891002, ack 1483103, win 65160, length 0
15:34:42.002129 IP 10.116.0.50.44902 > 10.116.0.22.80: Flags [.], ack 1, win 502, length 0
The output shows a complete TCP three-way handshake. 10.116.0.50 (the Load Balancer) sends SYN (flag S), the backend 10.116.0.22 responds with SYN-ACK (flag S.), and the Load Balancer acknowledges with ACK (flag .). Seeing all three in sequence confirms the probe reaches the backend and the backend responds at the TCP layer. If you see the S flag but no S., the backend is not accepting the connection despite packets arriving.
If probe packets are absent, inspect Cloud Firewall rules for the Load Balancer source IP. If probes are present but the backend is still marked unhealthy, inspect in-Droplet firewall policy and the health path response code.
Two additional edge cases to check when probes are present and the health endpoint returns 200 locally but the backend remains unhealthy in the control panel:
- Health check path mismatch: Confirm that the path configured in the Load Balancer health check settings matches the path your application actually serves. For example, if the LB is configured to probe
/healthbut the application only serves/healthz, every probe returns a 404 and the backend is marked unhealthy. Check the configured path under Networking > Load Balancers > Settings > Health Checks in the control panel. - TLS mismatch: If the Load Balancer is configured for HTTPS health checks but the backend Droplet only serves HTTP on the health check port, the TLS handshake fails and the backend is marked unhealthy. Confirm the protocol setting in the health check configuration matches what the application actually serves.
The Network Troubleshooting Runbook
The following runbook sequences the diagnostic steps above into a structured, repeatable incident response procedure. Each entry is organized by observable symptom so operators can locate the correct procedure quickly during active incidents.
Runbook Entry 1: Droplet Not Reachable from Another Droplet (VPC-Internal)
Symptom: Droplet A cannot connect to Droplet B’s private IP on a known service port.
Checks and Actions:
-
Confirm interface and private IP on the destination Droplet:
ip addr show eth1 -
Test baseline reachability from the source Droplet:
ping -c 4 10.116.0.22 traceroute -n 10.116.0.22 -
Confirm a listener exists on the destination for the expected port:
sudo ss -tlnp | grep -E ':22|:80|:443' -
Capture expected traffic on the destination interface while retrying the connection from the source:
sudo tcpdump -ni eth1 host 10.116.0.12 and port 443 -
Classify the root cause based on capture evidence:
- No packets seen in capture: check Cloud Firewall inbound rules and VPC routing.
- Packets seen with no reply: check
ufworiptableson the destination, then verify service binding. - Reply packets with
Rflag: service is not listening correctly or is actively rejecting the connection.
Runbook Entry 2: Load Balancer Returns 502 or 503
Symptom: Client requests to the Load Balancer return 502 or 503, or the target pool reports unhealthy backends.
Checks and Actions:
-
Confirm the Load Balancer frontend path is responding:
curl -v http://10.116.0.50/health -
Confirm the backend process is listening on the health check port:
sudo ss -tlnp | grep -E ':80|:443' -
Verify the health path returns a 2xx response on the backend directly:
curl -v http://127.0.0.1/health -
Capture health check probes from the Load Balancer IP:
sudo tcpdump -ni eth1 host 10.116.0.50 and port 80 -
Classify the root cause based on capture evidence:
- No probe packets visible: Cloud Firewall does not allow the probe source IP, or there is a routing issue.
- Probe packets with full handshake but non-2xx response: application health route mismatch.
- Probe packets present but session times out: local firewall block or application latency spike on the backend.
Runbook Entry 3: DNS Resolution Failure Inside VPC
Symptom: Application reports host resolution failures for internal or external names.
Reference: For detailed output interpretation and resolver drift diagnosis, see Step 4 - Diagnose DNS with dig and nslookup.
Checks and Actions:
-
Inspect configured resolvers on the failing Droplet:
cat /etc/resolv.conf -
Query the DigitalOcean resolvers directly to confirm they are reachable and returning answers:
dig @67.207.67.2 api.internal.example A dig @67.207.67.3 api.internal.example A -
Run a trace for delegation issues on public domains:
dig +trace example.com -
Validate that DNS packets leave the host and receive replies on the active egress path:
sudo tcpdump -ni any port 53 -
Classify the root cause based on results:
- Same query, different answer between two Droplets: resolver or search-domain configuration drift.
- No outbound DNS packets visible in an all-interface capture while queries are being generated: the query may not be leaving the host, or the host resolver path may be misconfigured.
- Outbound packets present but no replies: Cloud Firewall, routing, or upstream resolver path issue.
Runbook Entry 4: Intermittent Connectivity or Latency Spikes
Symptom: A service is reachable most of the time but shows intermittent connection failures, sporadic timeouts, or latency spikes that fall outside normal baseline.
Checks and Actions:
-
Measure sustained reachability and loss profile over a longer interval than a default ping run:
ping -c 100 -i 0.2 10.116.0.22 -
Capture TCP handshake traffic for the affected service while the incident is active:
sudo tcpdump -tt -ni eth1 'tcp[tcpflags] & (tcp-syn|tcp-ack) != 0 and port 443' -w latency-incident.pcap -
Measure handshake latency from the live capture to quantify the spike:
sudo tcpdump -tt -ni eth1 'tcp[tcpflags] & (tcp-syn|tcp-ack) != 0 and port 443' | awk ' {gsub(/:$/, "", $3); gsub(/:$/, "", $5)} /Flags \[S\]/ && !/Flags \[S\.\]/ {syn[$3 SUBSEP $5]=$1} /Flags \[S\.\]/ {key=$5 SUBSEP $3; if (key in syn) {print "Handshake latency:", ($1-syn[key])*1000, "ms"; delete syn[key]}}' -
Check socket-level drop counters and retransmit counts on the destination:
ss -s netstat -s | grep -iE 'retrans|drop|reset' -
Classify the root cause based on measurements:
- Packet loss above 1% with no firewall changes: investigate VPC interface health and contact support with the capture.
- Handshake latency consistently below 1 ms with occasional multi-millisecond spikes: application-layer contention, not network.
- Rising retransmit counts with no packet loss in ping: upstream congestion or MTU mismatch on the path.
- Drops only during peak hours: investigate backend capacity, not network policy.
Automating the Runbook with DigitalOcean Functions and AI Platform
Runbook steps that have explicit inputs, deterministic commands, and structured outputs are candidates for automation with DigitalOcean Functions.
DigitalOcean Functions is the serverless layer used by function routing in DigitalOcean AI Platform agents. Routed functions must be web functions, return output in a body key, and use an input schema aligned with OpenAPI 3.0 when registered through the control panel or API. Review the official reference before implementation: Route Functions in Agents.
This pattern mirrors the approach described in Modal’s autoscaling autoresearch post, where deterministic, repeatable operations become callable units that an agent can orchestrate. The runbook entries in this tutorial are that foundation: each step is scoped, produces structured output, and maps directly to a function an agent can call.
The following example function accepts a target IP and port, runs an nmap scan, and returns the port state in the format required by AI Platform function routing:
import re
import subprocess


def main(args):
    target_ip = args.get("target_ip")
    port = args.get("port")

    if not target_ip or not port:
        return {
            "statusCode": 400,
            "body": {
                "error": "target_ip and port are required"
            }
        }

    cmd = ["nmap", "-Pn", "-p", str(port), str(target_ip)]

    try:
        proc = subprocess.run(cmd, capture_output=True, text=True, timeout=20, check=False)
        raw = (proc.stdout or "") + (proc.stderr or "")
    except subprocess.TimeoutExpired:
        return {
            "statusCode": 504,
            "body": {
                "target_ip": target_ip,
                "port": int(port),
                "state": "timeout",
                "raw": "nmap execution timed out"
            }
        }

    state = "unknown"
    match = re.search(rf"{re.escape(str(port))}/tcp\s+(open|filtered|closed)\b", raw)
    if match:
        state = match.group(1)

    return {
        "statusCode": 200,
        "body": {
            "target_ip": target_ip,
            "port": int(port),
            "state": state,
            "raw": raw.strip()
        }
    }
A representative function response looks like this:
{
  "body": {
    "target_ip": "10.116.0.22",
    "port": 443,
    "state": "open",
    "raw": "PORT    STATE SERVICE\n443/tcp open  https"
  }
}
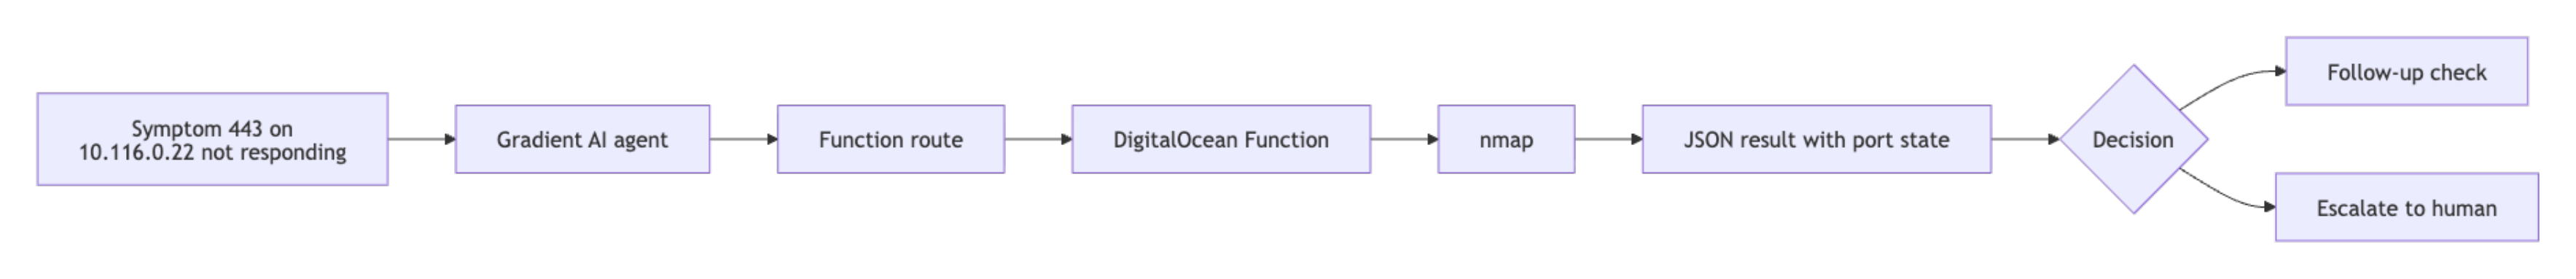
Once deployed and registered as a function route in an AI Platform agent, the agent can call this diagnostic automatically in response to a message such as “port 443 on 10.116.0.22 is not responding,” then use the structured output to route the response, escalate to a human, or trigger a follow-up check. If you are integrating with agent logic in Python, you can use the AI Python SDK.
Note: For DigitalOcean AI Platform function routing, the function must be a DigitalOcean web function and must return output in a body key. Your route definition must follow the schema requirements in the Route Functions in Agents documentation.
Best Practices for Maintaining Your Network Runbook
- Version each runbook entry in Git with date, environment, and owner metadata so you can track which infrastructure changes introduced new failure patterns. Use
git log --follow runbook/<entry>.mdto trace modification history during root cause analysis. - Store a known-good packet capture and representative command output for each critical service. During incidents, compare against the known-good baseline rather than reasoning from first principles. Capture baselines with
sudo tcpdump -ni eth1 -w baseline-<service>-<date>.pcap -c 200. - Standardize one command order for every incident: reachability, packet capture, port state, DNS, and health checks. Skipping steps wastes time when a lower-layer issue is masking a higher-layer symptom.
- Add post-incident updates within 24 hours, including which evidence changed the diagnosis and what the resolution was.
- Re-test Cloud Firewall rules, in-Droplet firewall config, and Load Balancer health checks after every infrastructure change. Re-run
nmap -Pn -p <port> <target>from the same source as before and diff the output against the previous result to catch silent policy regressions. - Wrap frequently repeated diagnostic steps as DigitalOcean Functions and register them as function routes for agent workflows, reducing the manual toil for on-call responders over time.
FAQ
What is a network troubleshooting runbook?
A network troubleshooting runbook is a documented sequence of diagnostic steps for specific symptoms, including commands, expected outputs, interpretation rules, and escalation paths. It standardizes incident response and ensures consistent diagnostic evidence regardless of which team member responds.
How do I use tcpdump to debug network issues inside a DigitalOcean VPC?
Run sudo tcpdump -ni eth1 on the target Droplet, substituting eth1 for your VPC private interface name. Use filters such as port 443 or src 10.116.0.12 and port 443 to narrow the capture to relevant traffic. If no packets from the expected source appear in the capture, the block is upstream at the Cloud Firewall level. If packets are present but sessions fail, investigate in-Droplet firewall policy, service binding, and application behavior.
What is the difference between DigitalOcean Cloud Firewalls and in-Droplet firewalls like ufw?
Cloud Firewalls filter traffic at the hypervisor level before it reaches the Droplet’s network interface. Traffic blocked by a Cloud Firewall will not appear in tcpdump captures inside the Droplet at all. ufw and iptables run inside the OS after the packet has already been delivered to the interface. Both layers can be active simultaneously and each enforces its rules independently. Absent packets in tcpdump point to a Cloud Firewall block; present packets without a service response point to an in-Droplet firewall or application issue.
How can nmap help troubleshoot DigitalOcean Load Balancer and VPC connectivity problems?
nmap classifies ports as open, filtered, or closed, which maps directly to the next action during incident response. Run nmap -Pn -p <port> <target-ip> from a Droplet inside the same VPC to test reachability toward a backend Droplet or the Load Balancer IP. A filtered result moves investigation to Cloud Firewall rules. A closed result moves investigation to service startup and bind address configuration.
Can these runbook steps be automated?
Yes. Steps that accept structured inputs such as an IP address, port, or hostname, and return structured outputs such as port state, DNS result, or packet count, are candidates for DigitalOcean Functions. Those functions can then be registered as function routes in an AI Platform agent, enabling the agent to execute diagnostic steps automatically in response to a symptom description. For the function requirements and schema format, see the Route Functions in Agents documentation.
How do I know which interface is my VPC interface without guessing between eth1 and ens4?
Run the following command to identify the interface associated with your private VPC IP:
ip -4 addr | grep -E '10\.|172\.(1[6-9]|2[0-9]|3[0-1])\.|192\.168\.'
This lists all private IP addresses. Match the IP to the interface name shown above it (for example, eth1 or ens4). That interface is your VPC interface and should be used for tcpdump, ss, and other diagnostics.
Alternatively, you can use:
ip route get <destination-private-ip>
This shows which interface the system uses to reach another Droplet in the VPC.
What do I do if my Droplet was created before the current VPC was configured?
Droplets created before a VPC was assigned will not automatically join that VPC. To fix this:
- Power off the Droplet from the control panel.
- Edit the Droplet’s networking settings and assign it to the correct VPC.
- Power it back on.
After reattachment, verify the interface appears with a private IP using:
ip addr
If no private interface appears, the Droplet was not successfully attached to the VPC.
How do I correlate a tcpdump timestamp with an application log?
Use tcpdump with high-precision timestamps and align them with your application logs.
sudo tcpdump -tttt -ni eth1 port 443
The -tttt flag prints human-readable timestamps with date and time. Compare these timestamps directly with your application logs to match events such as incoming requests, connection attempts, or timeouts.
For stricter correlation during incidents:
- Ensure both systems use synchronized time via
timedatectland NTP. - Note the exact timestamp of a request in logs, then locate the matching packet sequence in
tcpdump.
This helps confirm whether delays occur at the network layer (packet arrival) or inside the application (processing latency).
Conclusion
This tutorial covered building an incident-oriented workflow for troubleshooting DigitalOcean VPCs, from reachability and packet capture to DNS validation, Load Balancer diagnostics, and symptom-based runbook entries organized for fast incident response.
You can now troubleshoot Droplet connectivity failures, identify Cloud Firewall versus in-Droplet firewall behavior, diagnose DNS resolution issues, and automate repeatable checks as DigitalOcean Functions for DigitalOcean AI Platform agent routes.
For next steps, deepen routing analysis with the VPC peering technical deep dive, then extend your validation workflow with the guide on testing firewall configurations with nmap and tcpdump.
Thanks for learning with the DigitalOcean Community. Check out our offerings for compute, storage, networking, and managed databases.
About the author
Building future-ready infrastructure with Linux, Cloud, and DevOps. Full Stack Developer & System Administrator. Technical Writer @ DigitalOcean | GitHub Contributor | Passionate about Docker, PostgreSQL, and Open Source | Exploring NLP & AI-TensorFlow | Nailed over 50+ deployments across production environments.
Still looking for an answer?
This textbox defaults to using Markdown to format your answer.
You can type !ref in this text area to quickly search our full set of tutorials, documentation & marketplace offerings and insert the link!
 This work is licensed under a Creative Commons Attribution-NonCommercial- ShareAlike 4.0 International License.
Become a contributor for community
Get paid to write technical tutorials and select a tech-focused charity to receive a matching donation.

DigitalOcean Documentation
Full documentation for every DigitalOcean product.

Resources for startups and AI-native businesses
The Wave has everything you need to know about building a business, from raising funding to marketing your product.
The developer cloud
Scale up as you grow — whether you're running one virtual machine or ten thousand.

Start building today
From GPU-powered inference and Kubernetes to managed databases and storage, get everything you need to build, scale, and deploy intelligent applications.
